Viktor Jung · 20 October 2026
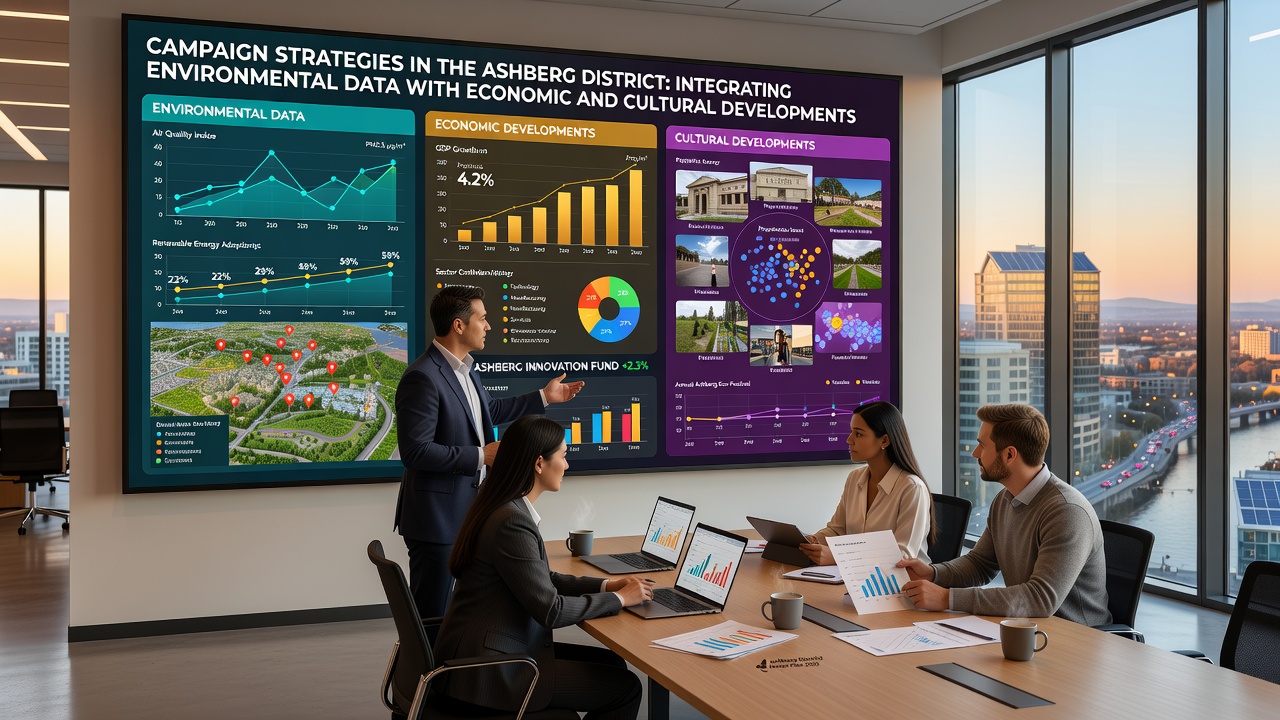
Campaign Strategies in the Ashberg District: Integrating Environmental Data with Economic and Cultural Developments
Campaign strategies across the Ashberg District have shifted toward systematic integration of environmental datasets with projections for economic growth and cultural preservation initiatives, and observers note that this approach draws on layered information sources to shape policy proposals ahead of upcoming local elections. Data from district monitoring stations reveal patterns in air quality, water flow, and land use that planners combine with employment statistics and tourism revenue figures to outline targeted outreach efforts. In October 2026, updated environmental indicators are scheduled for public release, which will allow campaign teams to refine messaging around sustainable development corridors that connect industrial zones with heritage sites.
Data Layers Shaping Campaign Platforms
Environmental records collected over the past decade show fluctuations in seasonal biodiversity metrics that align with specific commercial activity spikes in the district, and researchers at regional universities have mapped these correlations to identify zones where green infrastructure investments could support both job creation and arts programming. Campaign organizers use geographic information systems to overlay pollution dispersion models onto maps of cultural venues and retail corridors, which produces visual aids for public meetings. Figures from the district's economic development office indicate that areas with improved environmental scores have attracted higher rates of small business formation since 2023, and this trend informs platform language about balanced expansion.
Those who coordinate voter outreach programs report that residents respond to presentations when data visualizations include both carbon reduction targets and projected cultural festival attendance numbers, and such combined displays appear in digital toolkits distributed by multiple candidate committees. European Environment Agency reports on urban air quality trends provide comparative benchmarks that local analysts adapt to Ashberg-specific conditions, allowing campaigns to reference broader continental patterns without overstating local applicability.
Economic Projections Tied to Environmental Benchmarks
Economic forecasts generated by district analysts incorporate environmental compliance costs as variables that influence projected returns on mixed-use developments, and these models feed directly into campaign position papers distributed at community forums. Data shows that parcels meeting stricter habitat protection standards have commanded higher lease rates in recent quarters, which campaign materials highlight when discussing long-term revenue stability. Teams preparing October 2026 events plan to release interactive dashboards that let residents adjust assumptions about tourism growth against measured changes in local waterway health, thereby illustrating trade-offs in real time.

Industry groups focused on sustainable construction have supplied case examples from comparable districts where integrated planning reduced permitting delays, and these examples appear in Ashberg campaign literature as reference points rather than direct prescriptions. Observers tracking donor patterns note that contributors from both manufacturing and creative sectors increasingly request evidence of cross-sector data alignment before committing resources to particular candidates.
Cultural Programming Linked to Environmental Indicators
Cultural organizations in the district have begun submitting grant applications that reference environmental monitoring results alongside attendance projections, and this practice has prompted campaign strategists to include parallel metrics in their policy summaries. Records from the past five years demonstrate that outdoor arts events scheduled during periods of favorable air quality readings achieve measurably higher participation rates, which planners now factor into proposed festival calendars. Campaign literature distributed in advance of the 2026 election cycle pairs descriptions of new performance spaces with commitments to maintain adjacent green buffers that support both ecological and aesthetic goals.
Australian government environmental reporting frameworks offer templates for tracking cultural site resilience against climate variables, and district analysts have adapted elements of those frameworks to generate localized risk assessments that appear in candidate briefing materials. Such adaptations allow campaigns to address preservation concerns through quantitative language that resonates with both heritage advocates and fiscal oversight committees.
Implementation Timelines and October 2026 Milestones
Campaign calendars list October 2026 as a key checkpoint when fresh environmental datasets will intersect with updated economic indicators, and strategy documents outline phased rollouts of public consultation sessions timed to these releases. Coordination between data providers and campaign communications teams ensures that preliminary findings reach candidate websites within days of official publication, which supports rapid response to emerging voter questions. Those managing volunteer networks receive training on interpreting combined datasets so that door-to-door conversations can reference specific neighborhood-level statistics without requiring specialized technical knowledge.
Conclusion
Integration of environmental, economic, and cultural data streams has become a standard component of campaign architecture in the Ashberg District, and the October 2026 data releases will test how effectively these combined resources translate into voter engagement and policy formation. District records continue to supply the factual foundation for materials that address multiple stakeholder priorities within single narrative frameworks.